Breaststroke: strokes, rows and glides
BreastStroke swimming is a sequence of strokes including a row and a glide phase. During a stroke, the arms row first and stretch forward after. When they reach out forward, the legs close and push.
The strokes have some interesting features:
- They are synchronized. When the arms advance after their row, the legs kick and push.
- They are symmetric. Arms and legs perform in mirror symmetry.
- They are cyclic. A stroke ends in its start position.
The drawing below shows how a swimmer moves through a stroke. Remark the contraction and stretching of the whole body.
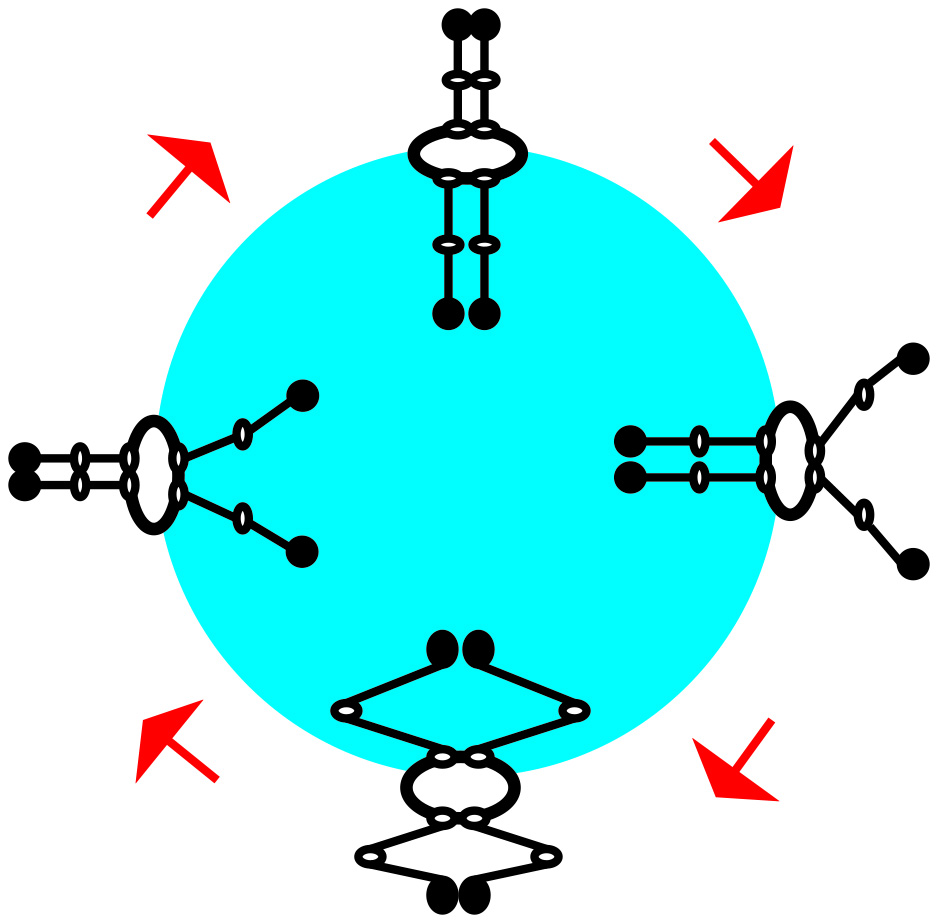
Watch sensors profit from this structure when they observe breast strokes. The main movement can be seen from the deviation angles of the wrist. Wrist turn angles render the orientation of the palms. Acceleration can be attributed either to the rowing arms or to the kicking legs when the arms are gliding.
The BreastStroke app relies on such a data-driven model. If you want to know more, look at the explanation for app users and developers: Breaststroke on a watch
Have fun!!!
The technical side
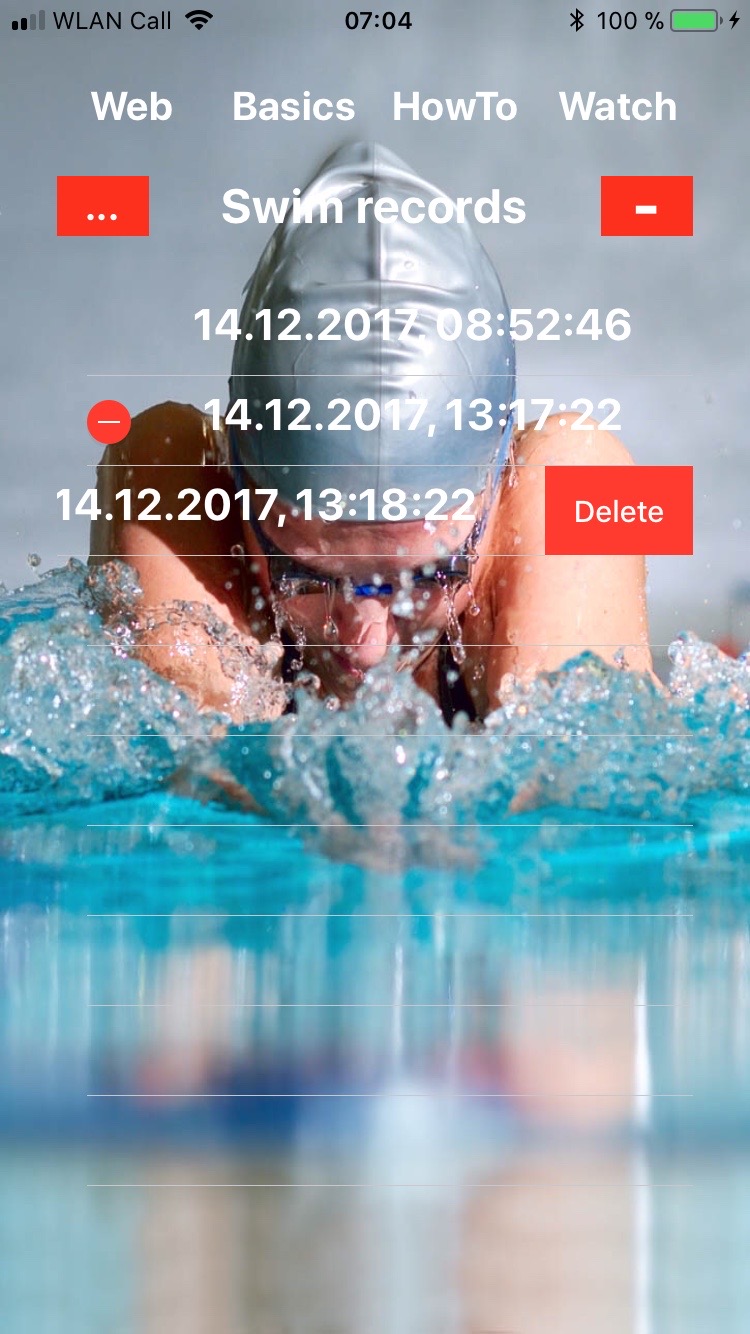
Handling the BreastStroke app is easy. It is explained on the app. Main points:
- On the phone, the sample collection is managed right on the first table (see left). Elsewhere you simply look and navigate.
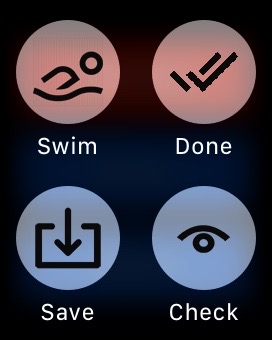
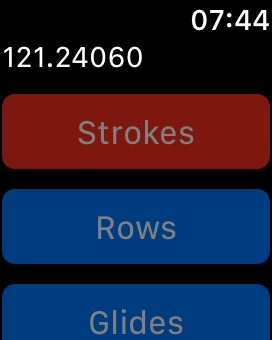
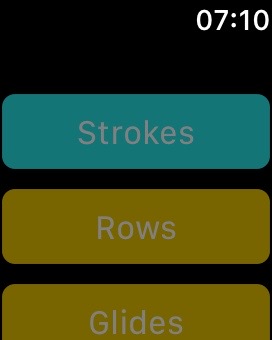
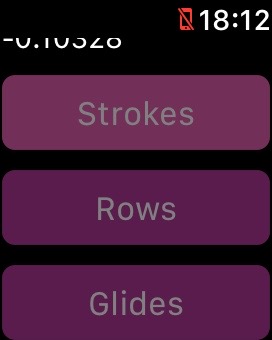
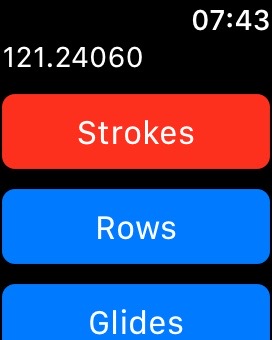
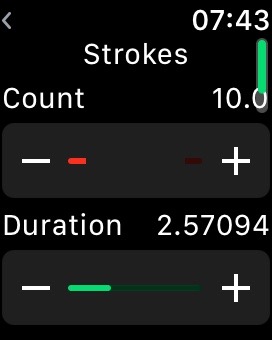
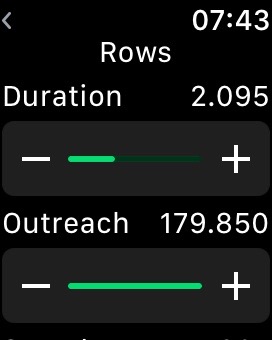
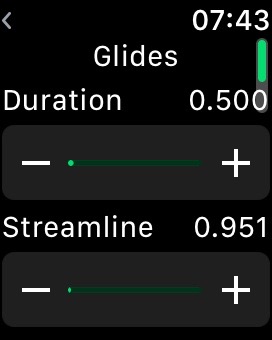
- On the watch you need strong presses for the menue and its buttons and light presses for the data screens.
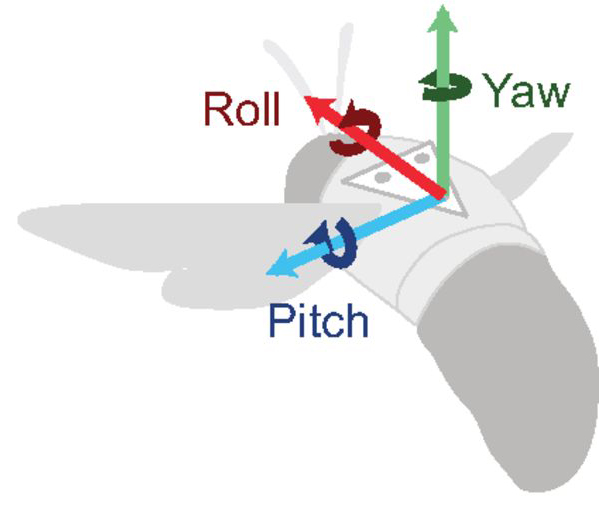
The watch behaves like many objects that freely move in space with some speed in time intervals and an attitude of their own. The bumblebee above demonstrates its three core values:
- The horizontal direction is recorded by the yaw value.
- The pitch value is set by going up and down in space.
- On roll you find the turns of the object around its own axis.
In a sample, values are aggregated to averages or min/max values so that users can interpret them.
